Observability Monitoring System
MSA 모니터링 & 운영 가시성 확보MSA Monitoring & Operational Visibility
1. 프로젝트 개요1. Project Overview
Prometheus + Grafana, Fluent Bit + OpenSearch, Slack Alert으로 구성된 모니터링 시스템Monitoring system: Prometheus + Grafana, Fluent Bit + OpenSearch, Slack Alert
| 항목Item | 내용Details |
|---|---|
| 프로젝트명Project | Observability Monitoring System |
| 분류Category | 사내 인프라 — MSA 모니터링 & 운영 가시성 확보Internal Infrastructure — MSA Monitoring & Operational Visibility |
| 개발 기간Duration | 2023.01 ~ 현재 (지속적 운영)Jan 2023 – Present (continuous operation) |
| 역할Role | 설계, 구축, 운영Design, build, and operations |
2. 프로젝트 배경과 기술 스택2. Background and Tech Stack
회사에 마이크로 서비스 아키텍처(MSA)가 처음 도입되는 시기인만큼, 기존 모놀리식과 달리 MSA 환경에서는 여러 서비스에서 다양한 요청이 처리되기 때문에 장애 지점을 파악하기가 어렵다.As MSA was first being introduced at the company, unlike monolithic architecture, multiple services handle various requests in an MSA environment, making it difficult to identify failure points.
이를 위해, MSA 환경 전반에 대한 운영 가시성 확보를 목표로 했다.To address this, the goal was to establish operational visibility across the entire MSA environment.
| 분류Category | 기술Technology |
|---|---|
| Metrics | Prometheus, Grafana |
| Log Collection | Fluent Bit (DaemonSet) |
| Log Storage & Analysis | AWS OpenSearch Service + Kibana |
| Alerting | FastAPI Middleware, Slack Incoming WebHook |
| Log Analytics | OpenAI API, OpenSearch API |
| Infrastructure | AWS EKS (Kubernetes), Karpenter, HPA |
| IaC / Deploy | Helm, kubectl, GitHub Actions |
3. 핵심 기술 구현3. Core Technical Implementation
3-1. 시스템 메트릭 수집 및 모니터링 (Prometheus + Grafana)3-1. System Metrics Collection and Monitoring (Prometheus + Grafana)
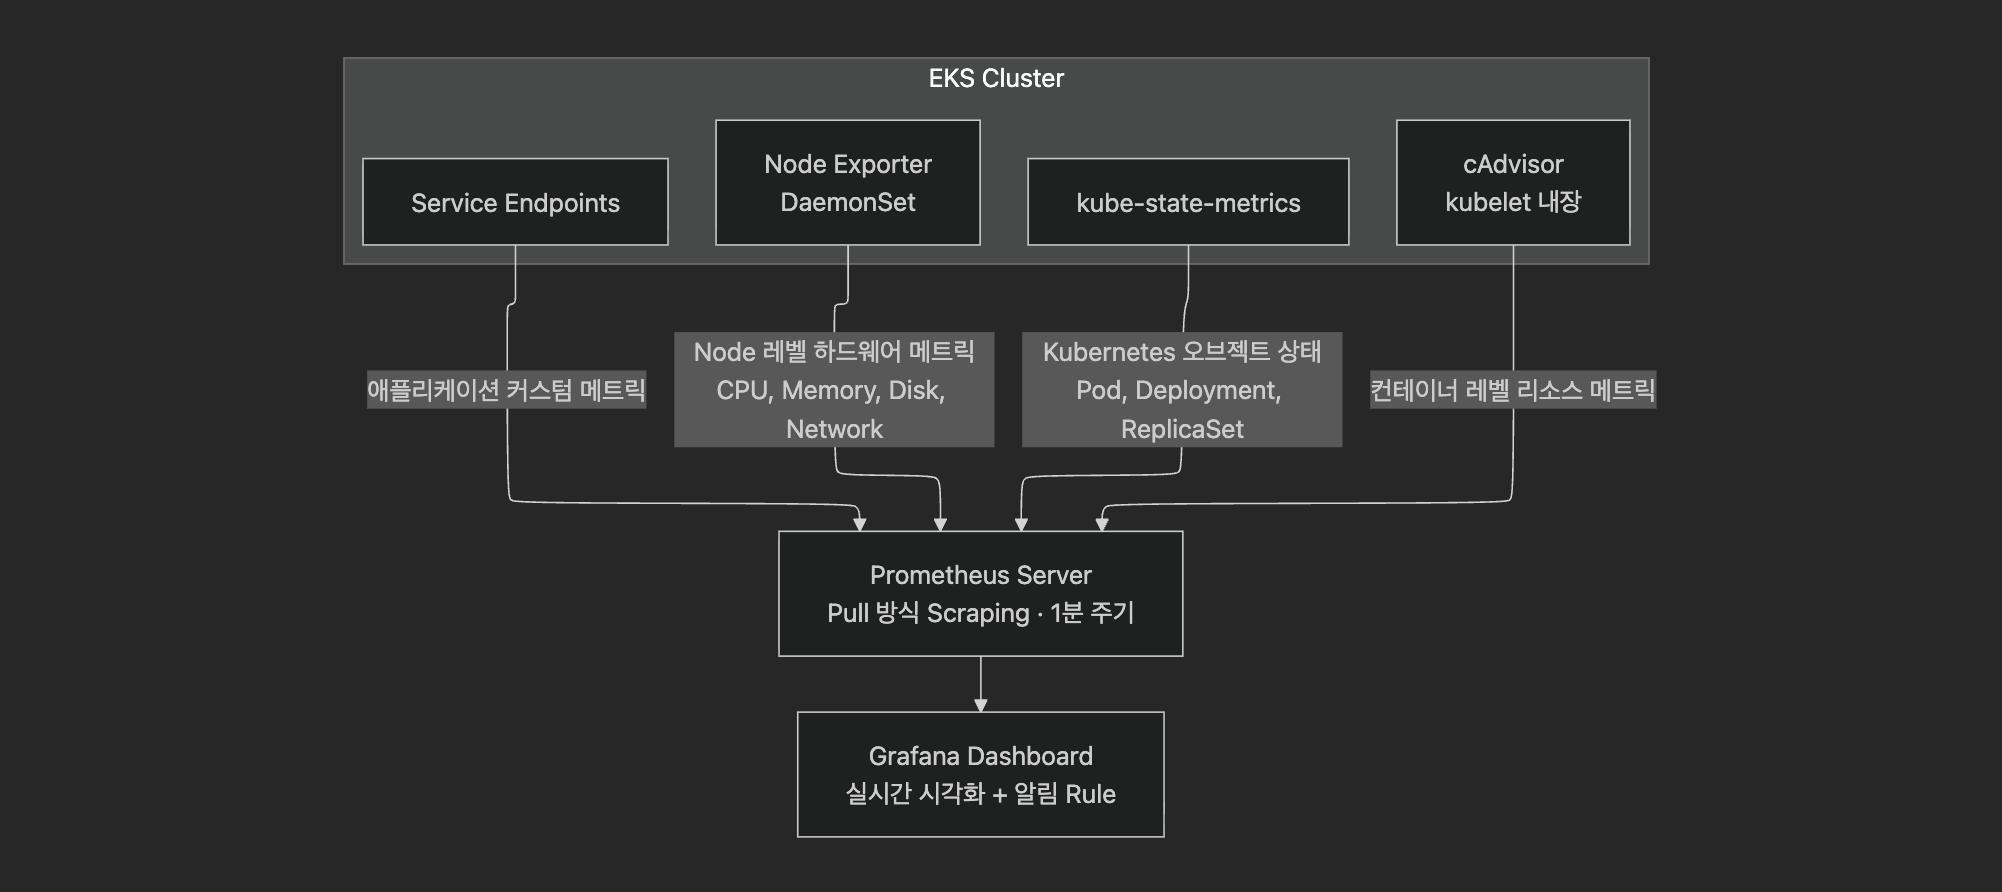
Prometheus의 kubernetes_sd_configs를 활용하여 EKS 클러스터 내 모든 Service Endpoint를 자동 탐색한다. 새로운 마이크로서비스가 배포되면 별도 설정 변경 없이 자동으로 메트릭 수집 대상에 포함된다.Prometheus's kubernetes_sd_configs automatically discovers all Service Endpoints within the EKS cluster. When a new microservice is deployed, it's automatically included in metric collection targets without configuration changes.
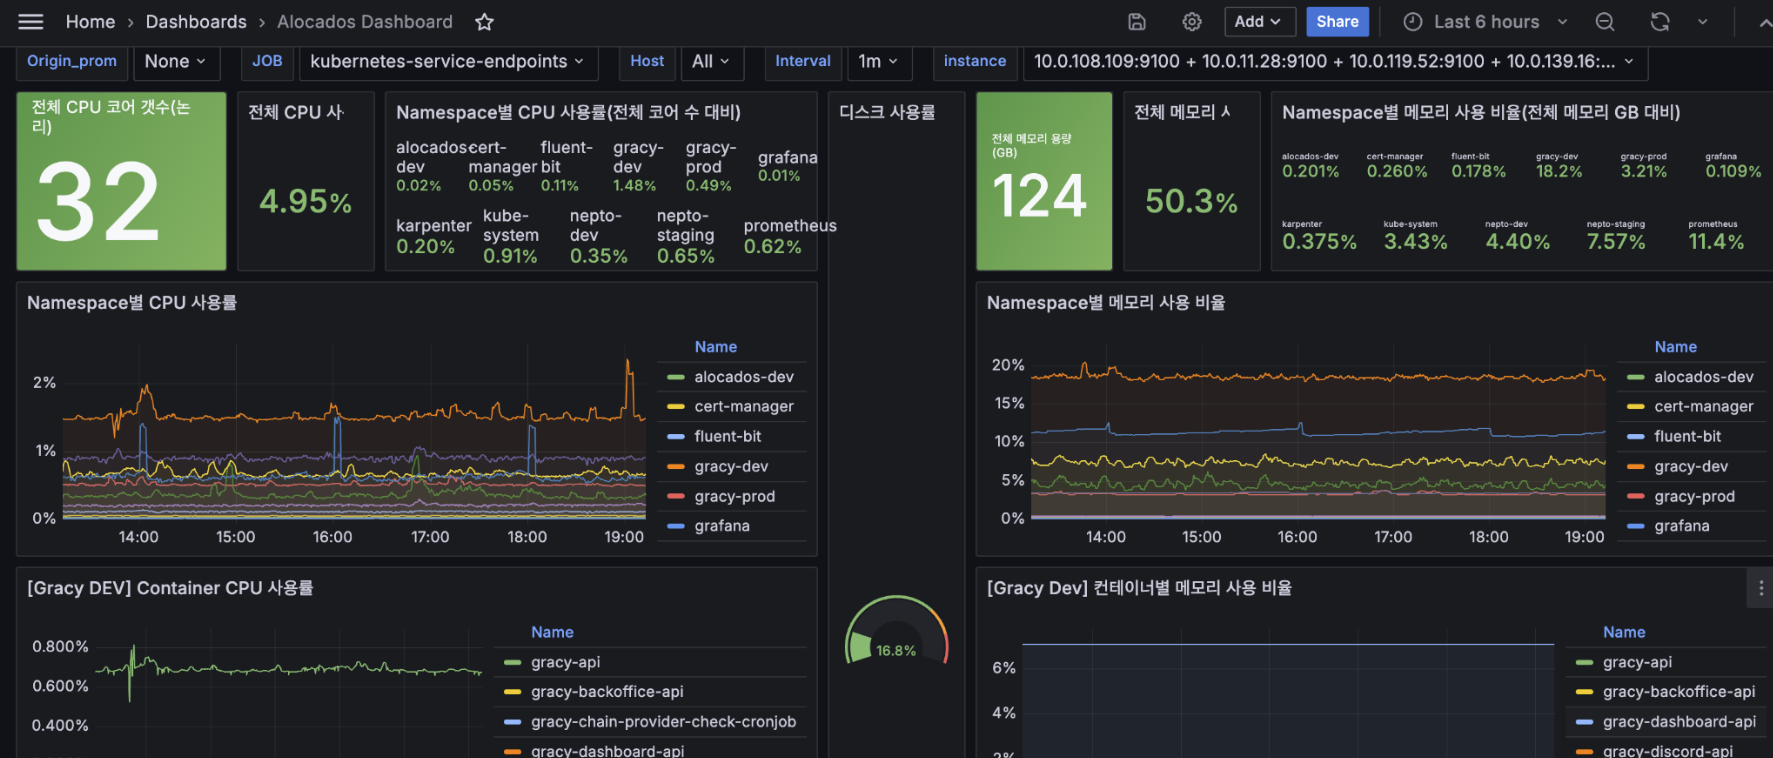
Grafana 대시보드: 클러스터 전체 → Namespace → 컨테이너 순으로 드릴다운할 수 있는 계층적 구조로 설계하여, 단일 대시보드에서 전체 건강 상태 파악부터 병목 컨테이너 식별까지 가능하도록 했다. Namespace별 리소스 점유 비율도 파악이 가능하다.Grafana Dashboard: Designed with a hierarchical drill-down structure (Cluster → Namespace → Container), enabling everything from overall health assessment to bottleneck container identification in a single dashboard. Per-Namespace resource utilization ratio is also available.
3-2. 컨테이너 로그 수집 및 분석 (Fluent Bit + OpenSearch & Kibana)3-2. Container Log Collection and Analysis (Fluent Bit + OpenSearch & Kibana)
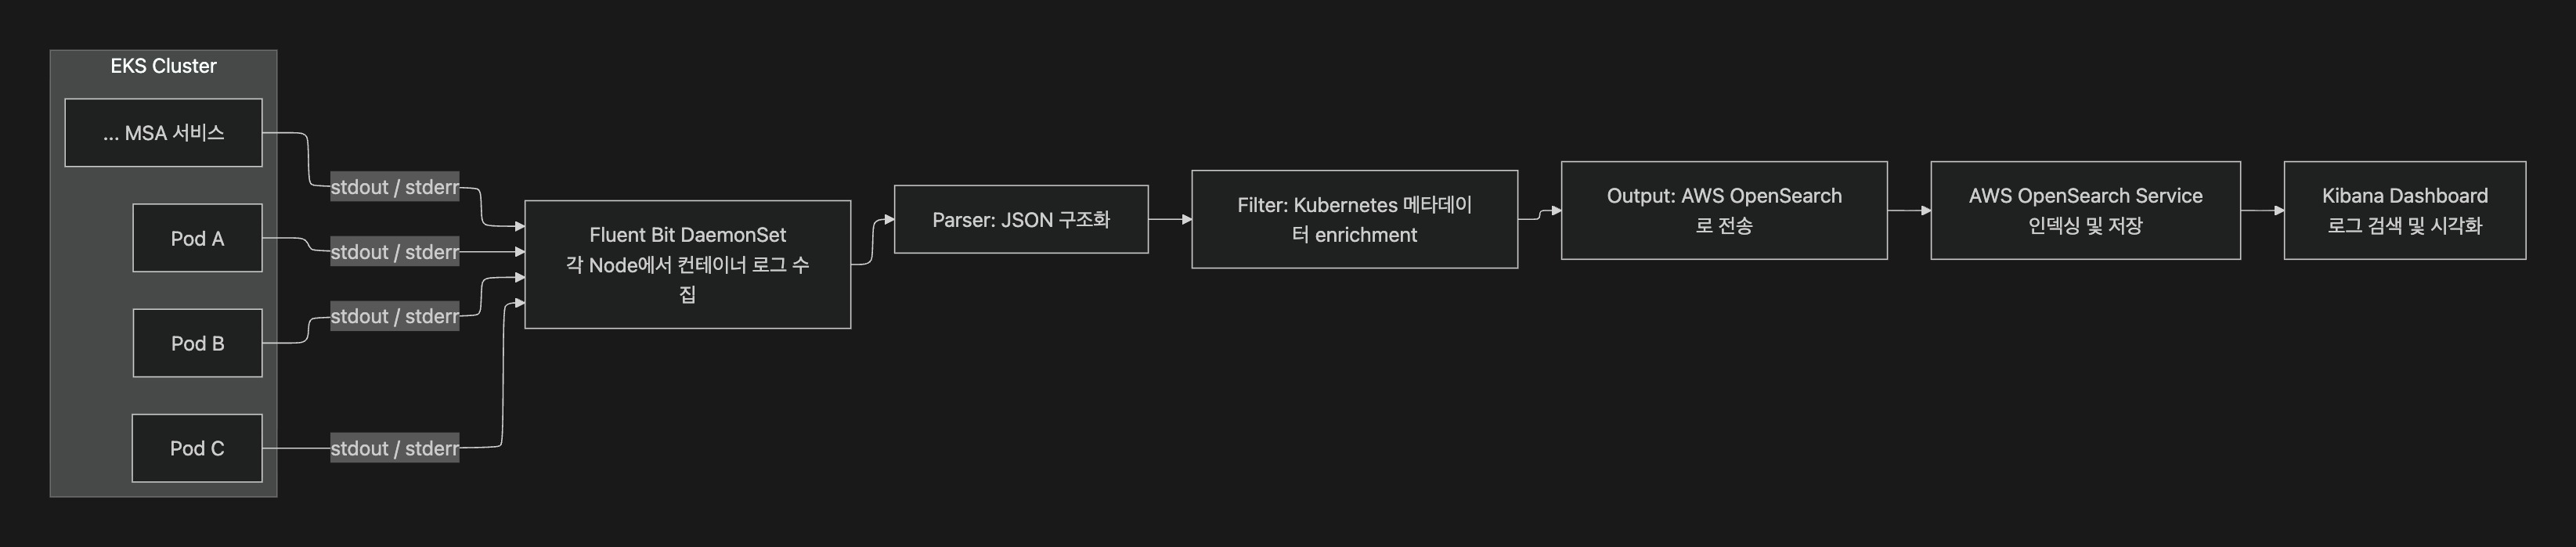
Fluent Bit을 DaemonSet으로 배포하여 모든 Worker Node의 컨테이너 로그를 수집하고, Kubernetes 메타데이터(Namespace, Pod Name, Labels 등)를 자동으로 부착하여 OpenSearch로 전송한다. 로그만으로 어떤 환경의 어떤 서비스에서 발생한 것인지 즉시 파악할 수 있다.Fluent Bit deployed as a DaemonSet collects container logs from all Worker Nodes, automatically enriches them with Kubernetes metadata (Namespace, Pod Name, Labels, etc.), and sends them to OpenSearch. Logs alone can immediately identify which environment and service an event originated from.
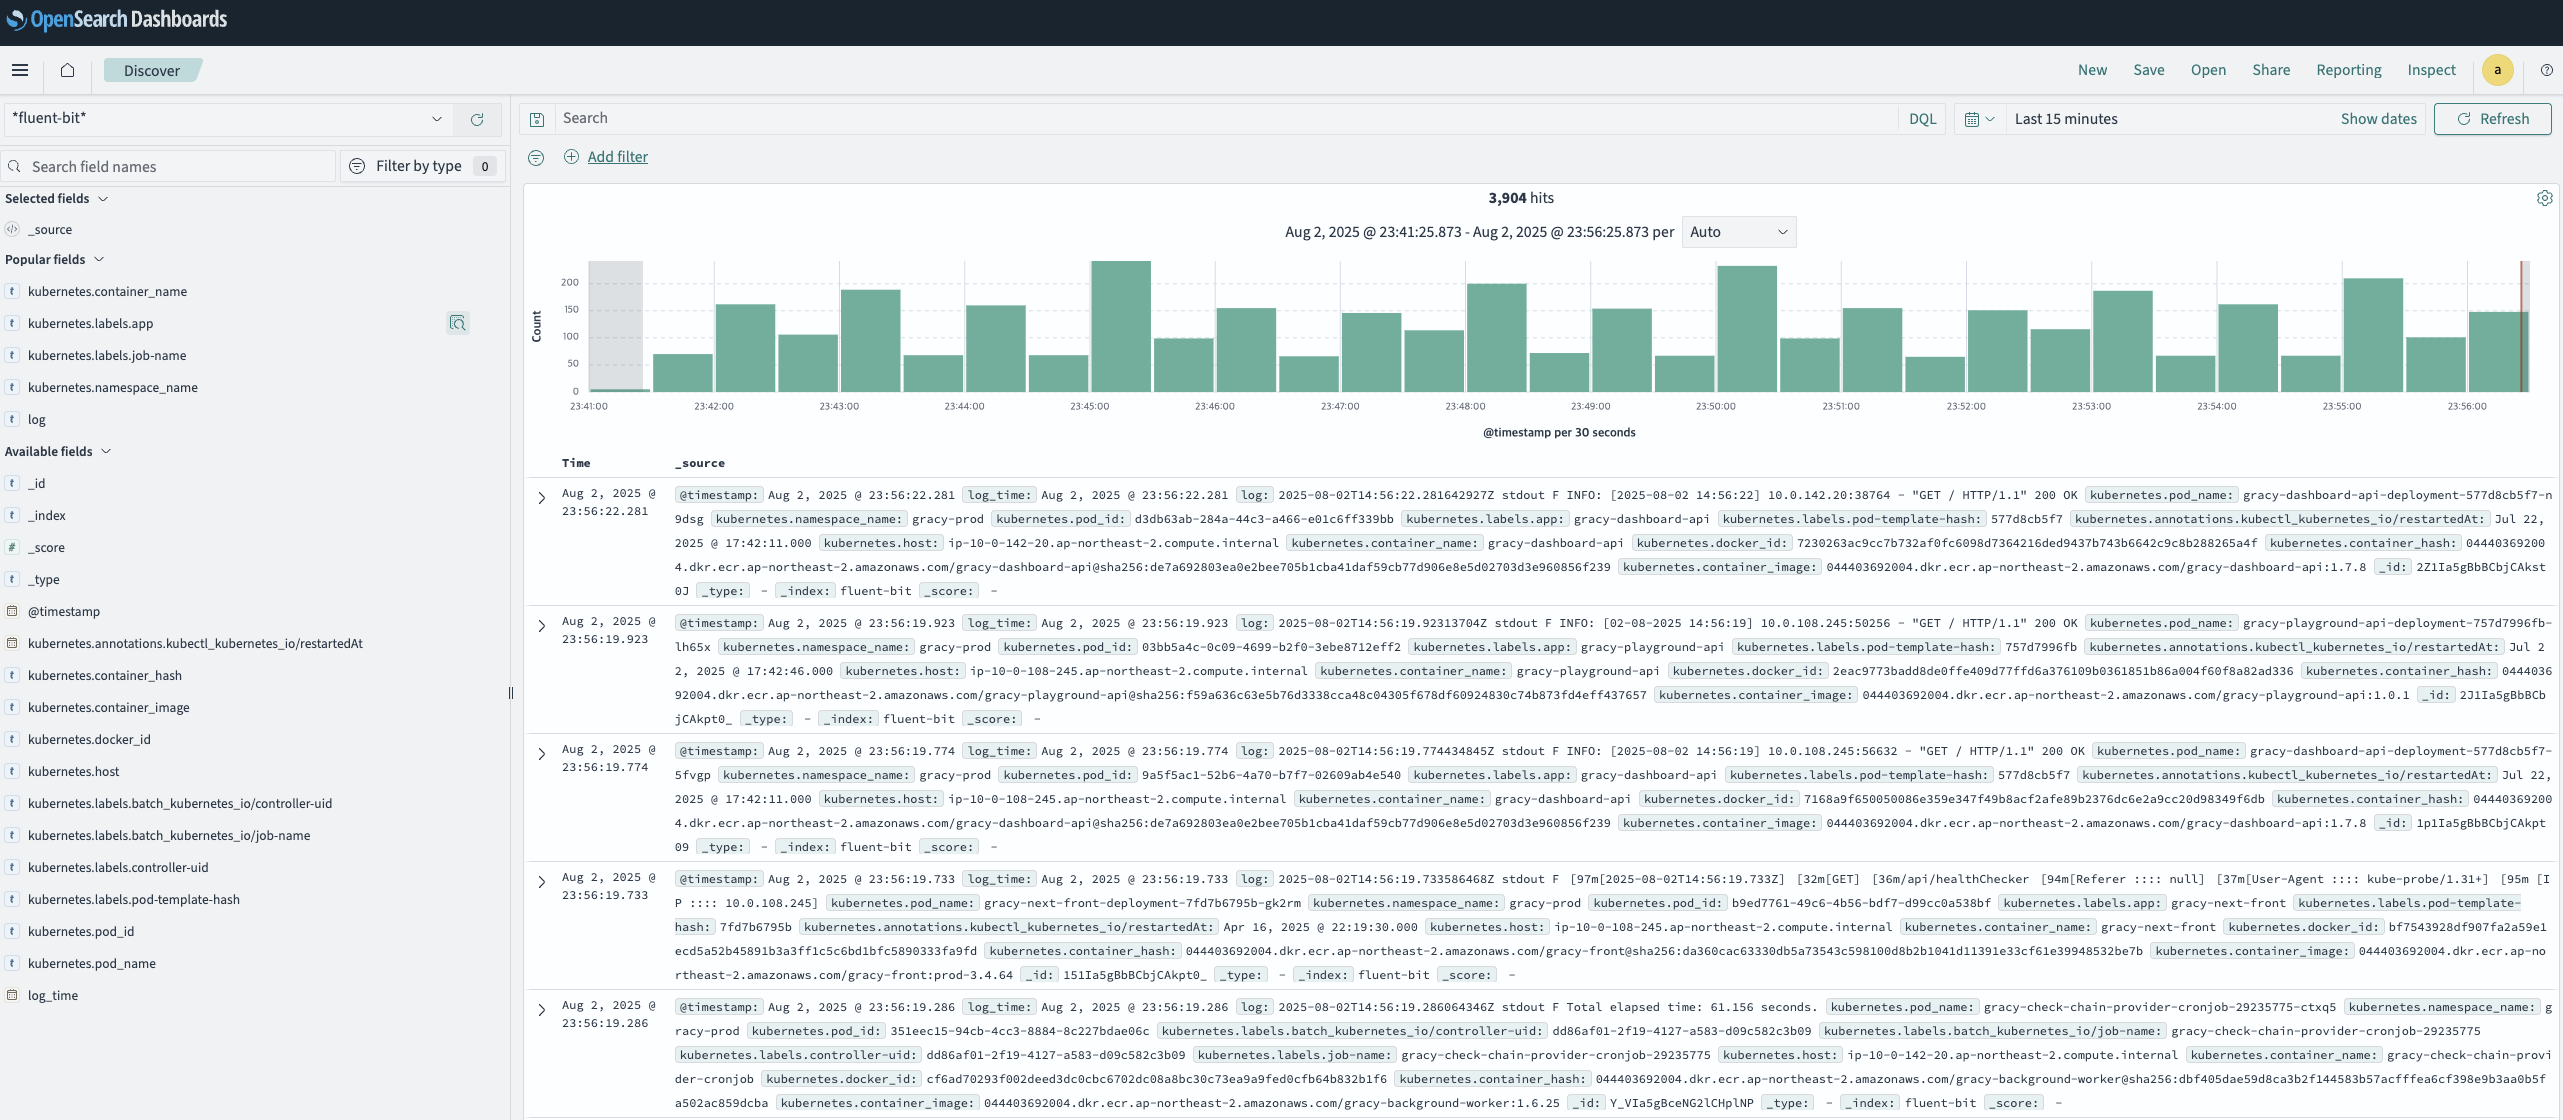
수집된 로그는 OpenSearch에 저장되며, Kibana를 통해 검색 및 시각화할 수 있다.Collected logs are stored in OpenSearch and can be searched and visualized through Kibana.
3-3. 장애 실시간 알림 시스템 (Slack Alert)3-3. Real-time Failure Alert System (Slack Alert)
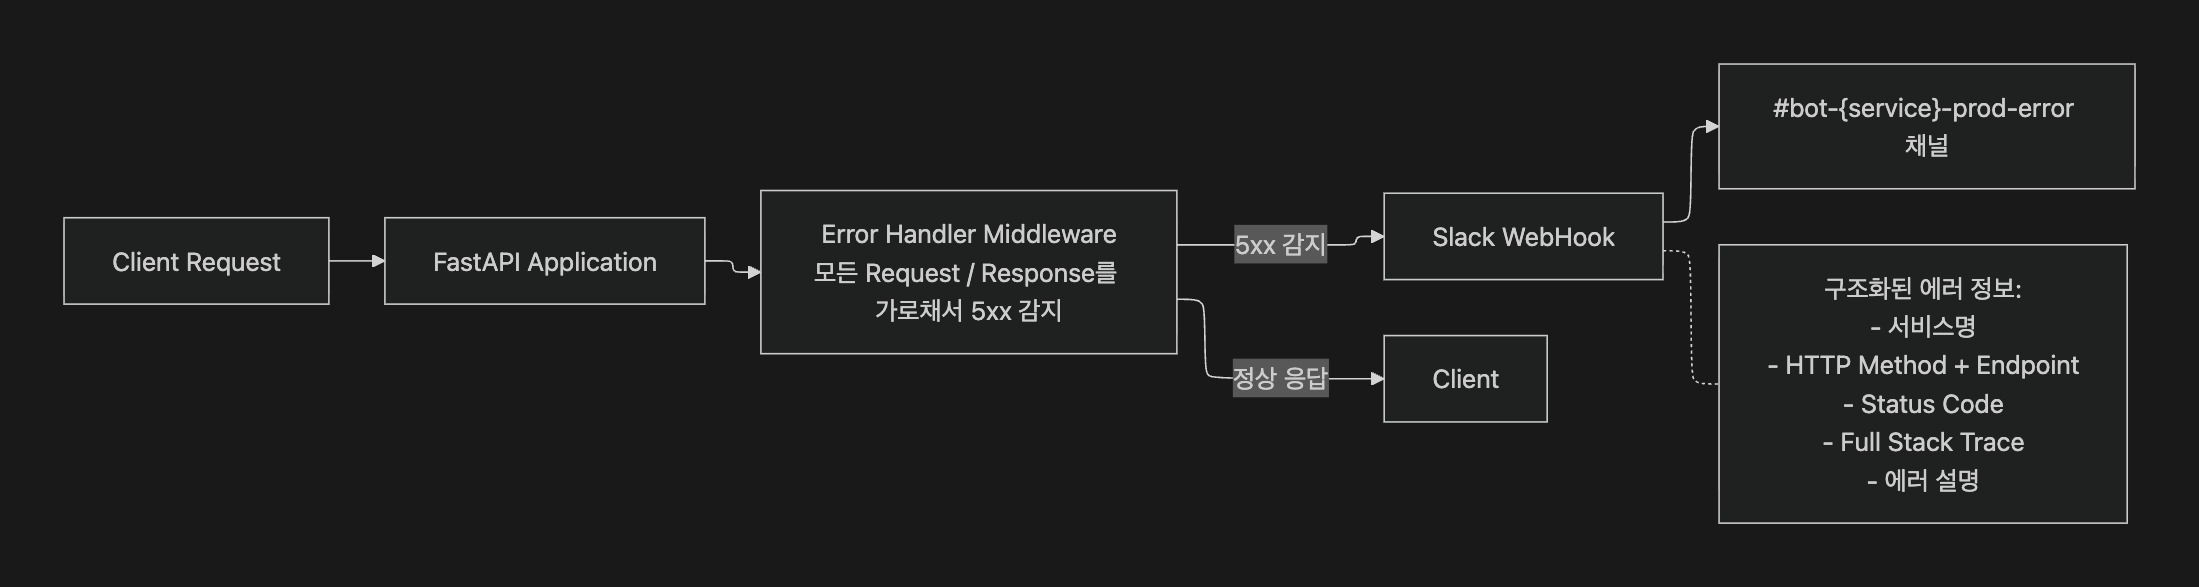
API 서비스는 FastAPI 기반으로, FastAPI Middleware에 Server Error Handler를 구현하여 5xx 에러 발생 시 서비스명, 환경, 엔드포인트, Stack Trace를 포함한 구조화된 알림을 Slack으로 즉시 발송한다.
모든 서비스가 공통 Middleware 모듈을 사용하므로, 새로운 서비스가 추가되어도 별도 설정 없이 알림이 자동 적용된다.A Server Error Handler is implemented as Middleware in each microservice. On 5xx errors, structured alerts including service name, environment, endpoint, and Stack Trace are immediately sent to Slack. Since all services use the shared Middleware module, alerts automatically apply to new services without configuration.
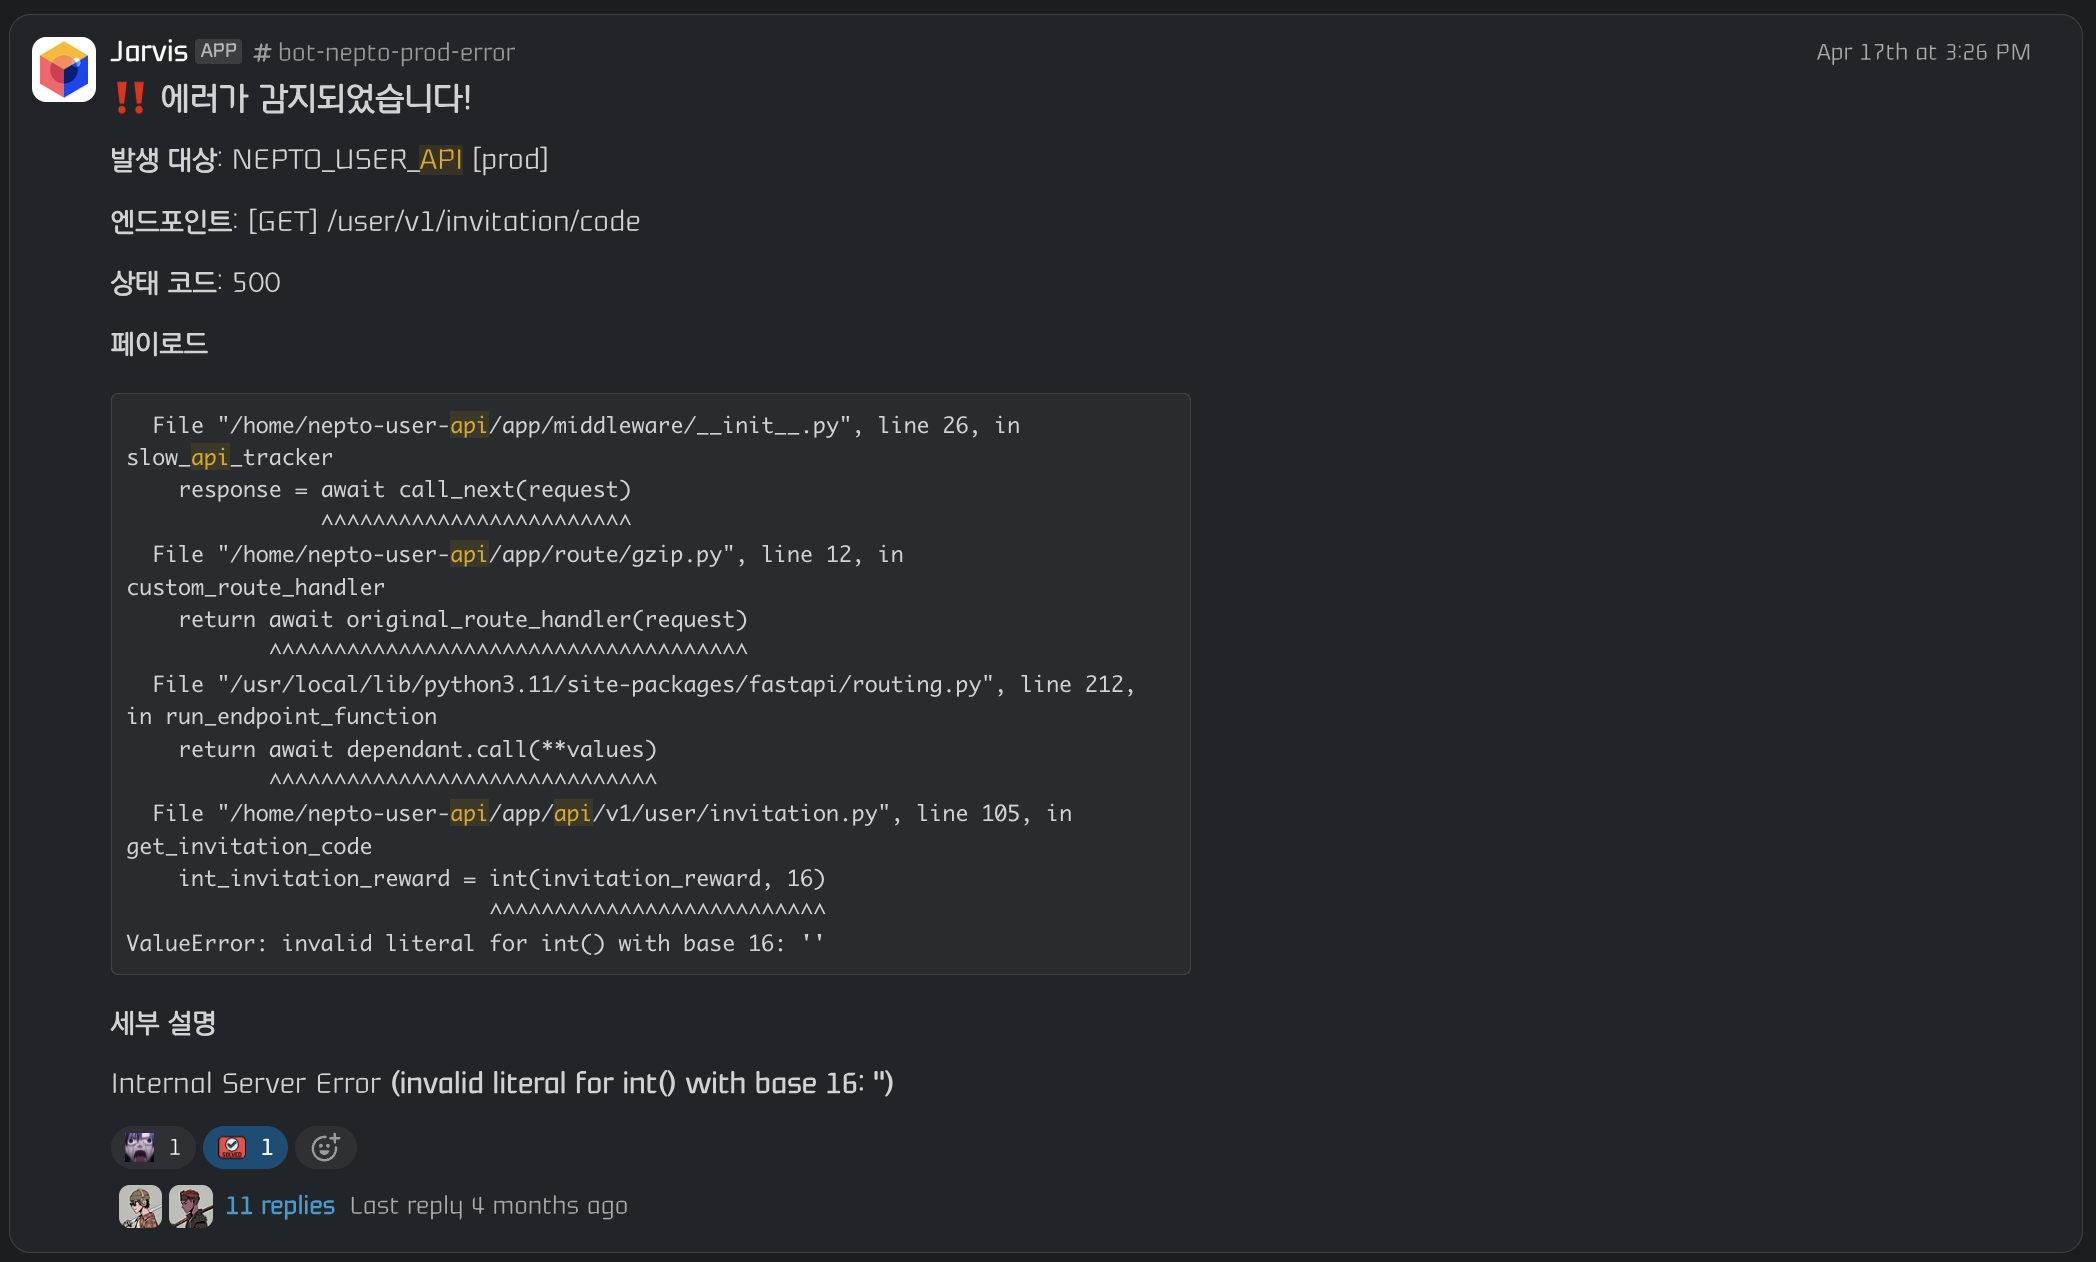
서비스별로 전용 에러 채널(#bot-nepto-prod-error, #bot-gracy-prod-error 등)을 분리하여 알림 노이즈를 방지하고, 각 채널의 Thread에서 바로 장애 대응 논의가 가능하도록 했다.Per-service error channels (#bot-nepto-prod-error, #bot-gracy-prod-error, etc.) are separated to prevent alert noise, with incident response discussions possible directly in each channel's Thread.
3-4. 자체 로그 메트릭 분석 시스템 (JARVIS Log Analytics)3-4. Custom Log Metric Analytics System (JARVIS Log Analytics)
Kibana를 통해 로그 중앙화는 해결했지만, 비즈니스 레벨의 집계 뷰가 부족했고, PM이나 마케터 등 비개발 직군이 OpenSearch DSL 쿼리를 직접 작성하여 로그를 분석하는 것은 쉬운 일이 아니다. 또한 스타트업 특성상 외부 데이터 분석 툴 도입은 비용 부담이 컸다.While log centralization was solved via Kibana, it lacked business-level aggregation views, and it was virtually impossible for non-engineers like PMs and marketers to write OpenSearch DSL queries for log analysis. Additionally, adopting external data analytics tools was cost-prohibitive for a startup.
LLM을 활용하여 당장 필요한 기능부터 자체 구축하는 방향을 택했다. 기존 사내 자동화 시스템인 JARVIS의 백엔드(FastAPI + OpenAI API)를 그대로 활용하고, 프론트엔드 페이지는 AI 바이브 코딩으로 빠르게 구축하여 OpenSearch에 수집된 로그 데이터를 기반으로 자체 로그 메트릭 분석 시스템을 만들었다.The approach was to leverage LLM to quickly build the most needed features in-house. Using the existing internal automation system JARVIS's backend (FastAPI + OpenAI API), with the frontend page rapidly built via AI vibe coding, a custom log metric analytics system was created.
Jarvis 시스템에 대한 자세한 내용은 Jarvis 참고For details on the Jarvis system, see Jarvis
Dashboard — 로그 집계 현황Dashboard — Log Aggregation Overview
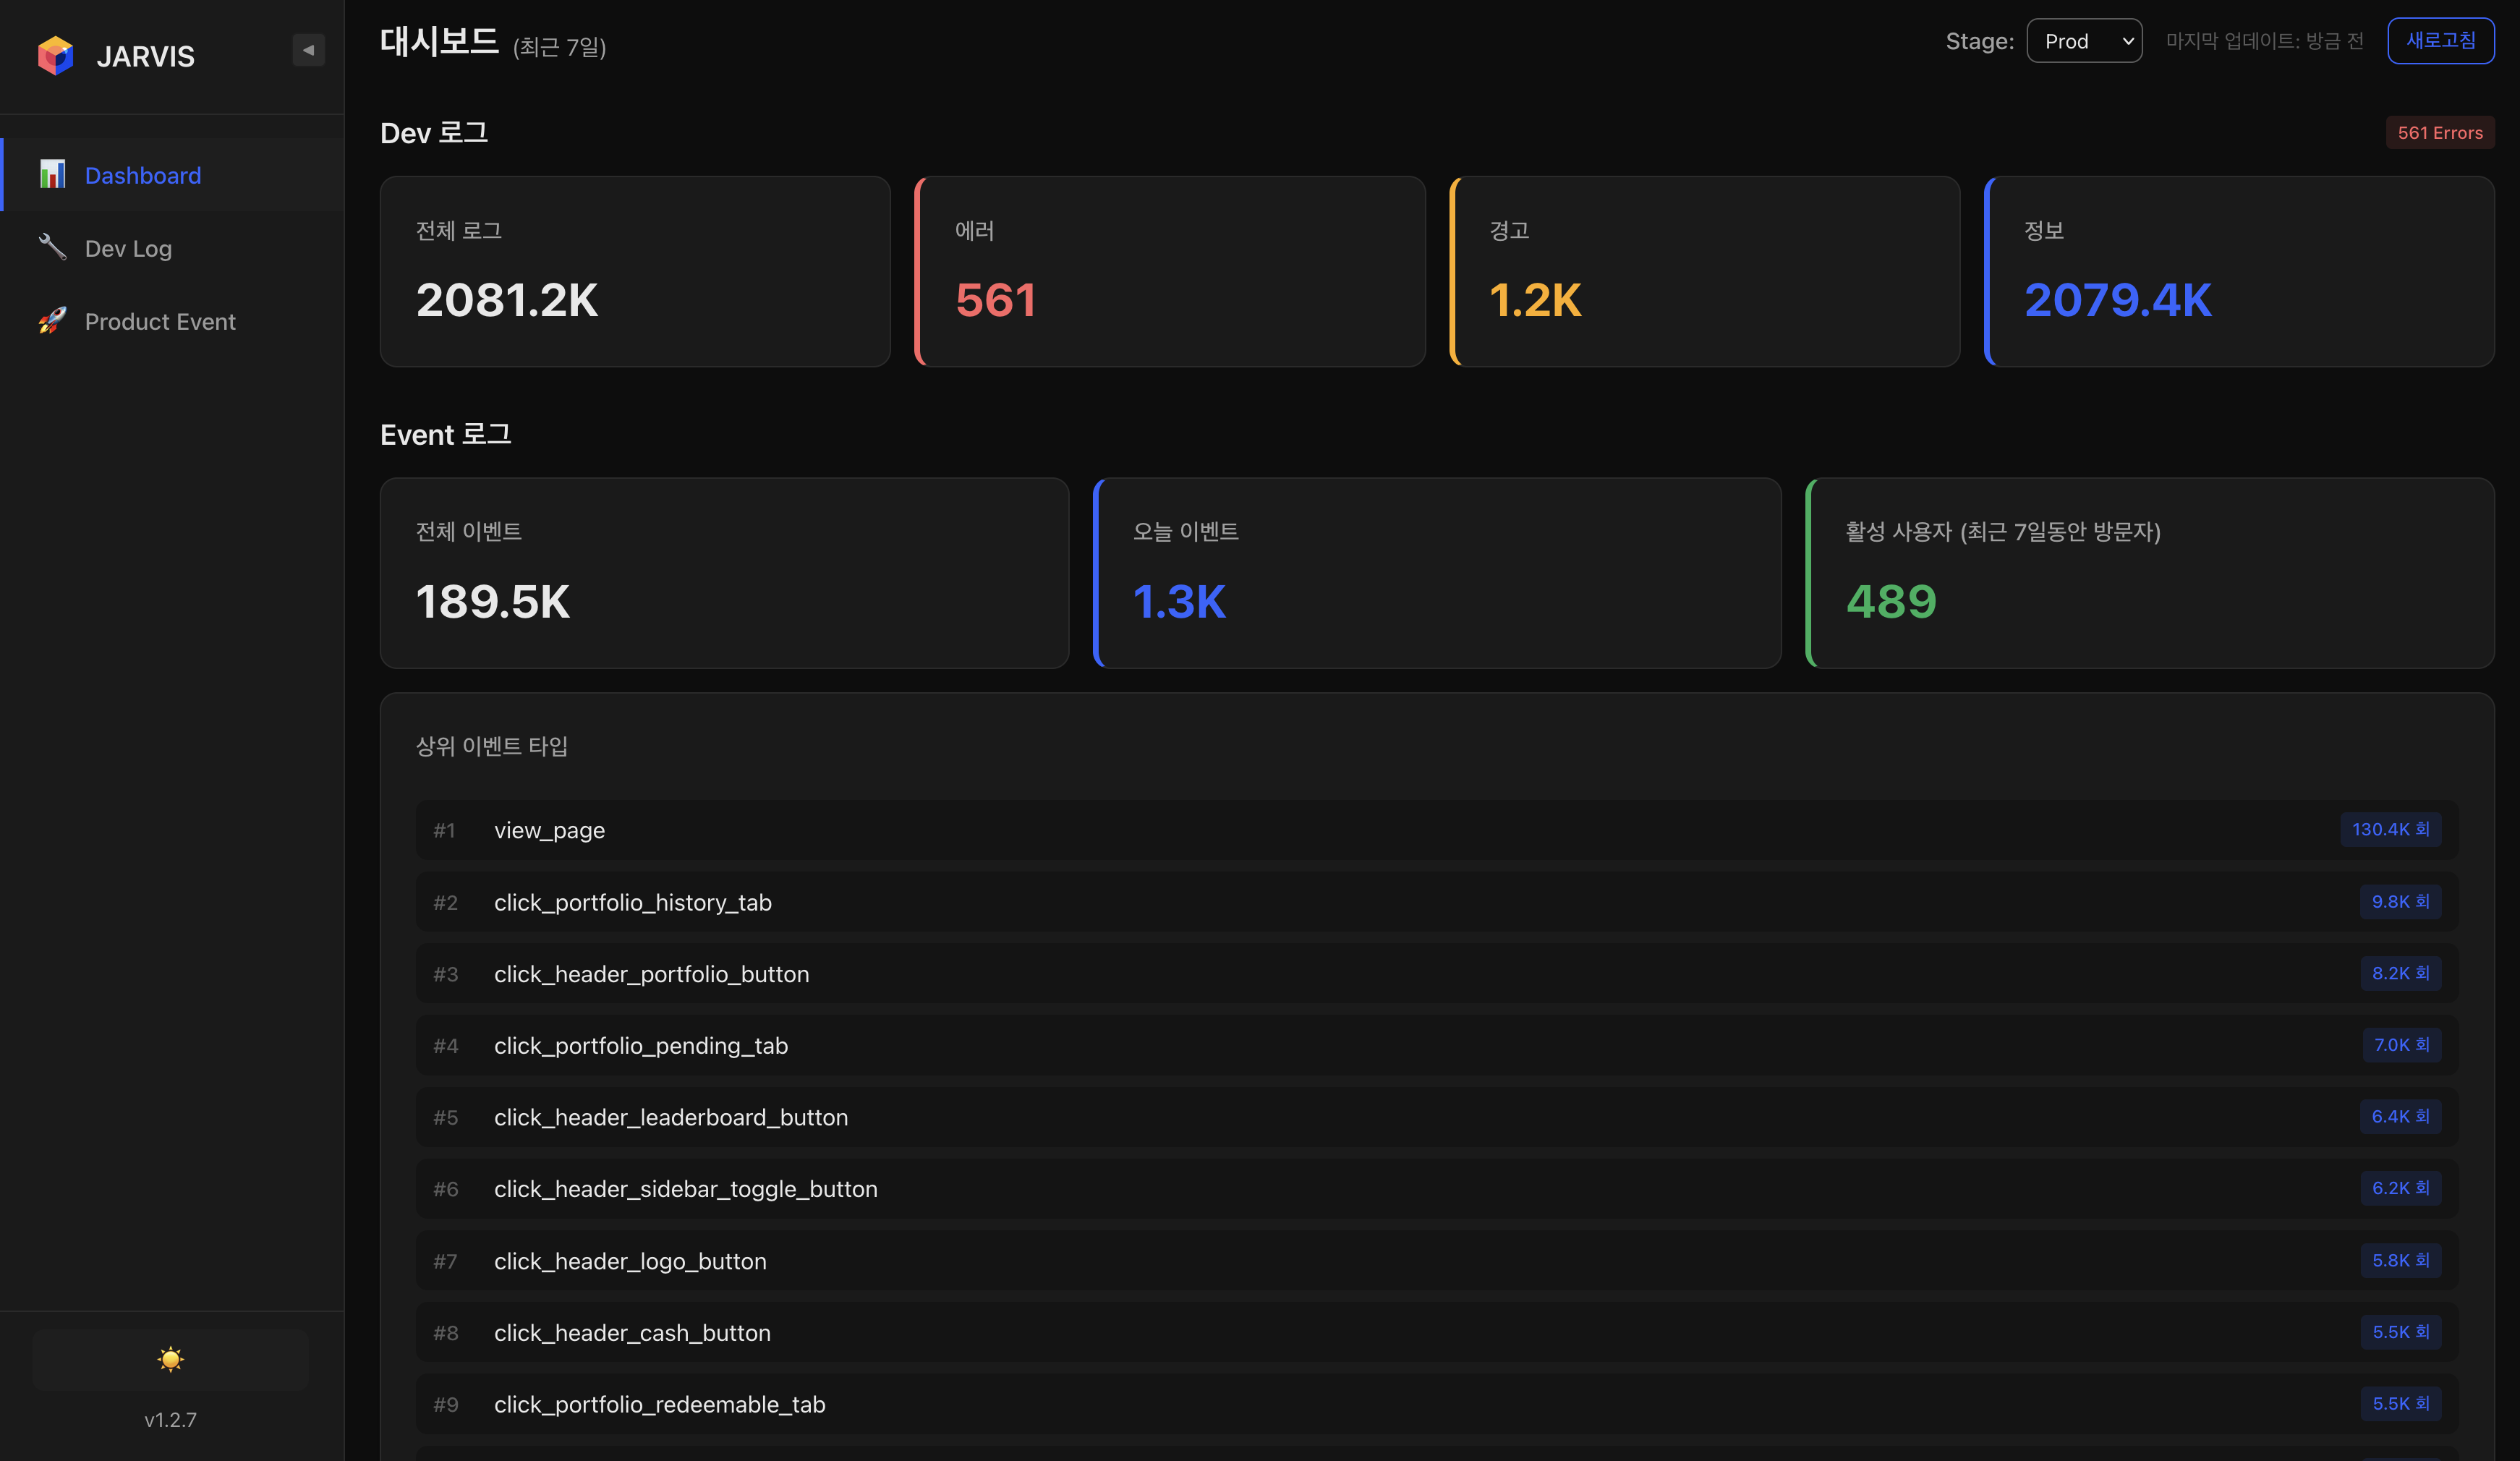
Dev 로그(전체 / 에러 / 경고 / 정상)와 Event 로그(전체 이벤트 / 오늘 이벤트 / 활성 이벤트) 집계를 한눈에 보여주며, 상위 이벤트 타입 분포를 실시간으로 확인할 수 있다. Stage / Prod 환경 선택으로 환경별 분석이 가능하다.Provides an at-a-glance view of Dev log aggregation (total / error / warning / normal) and Event log aggregation (total / today / active events), with real-time top event type distribution. Stage / Prod environment selector enables per-environment analysis.
Search — 구조화된 로그 검색Search — Structured Log Search
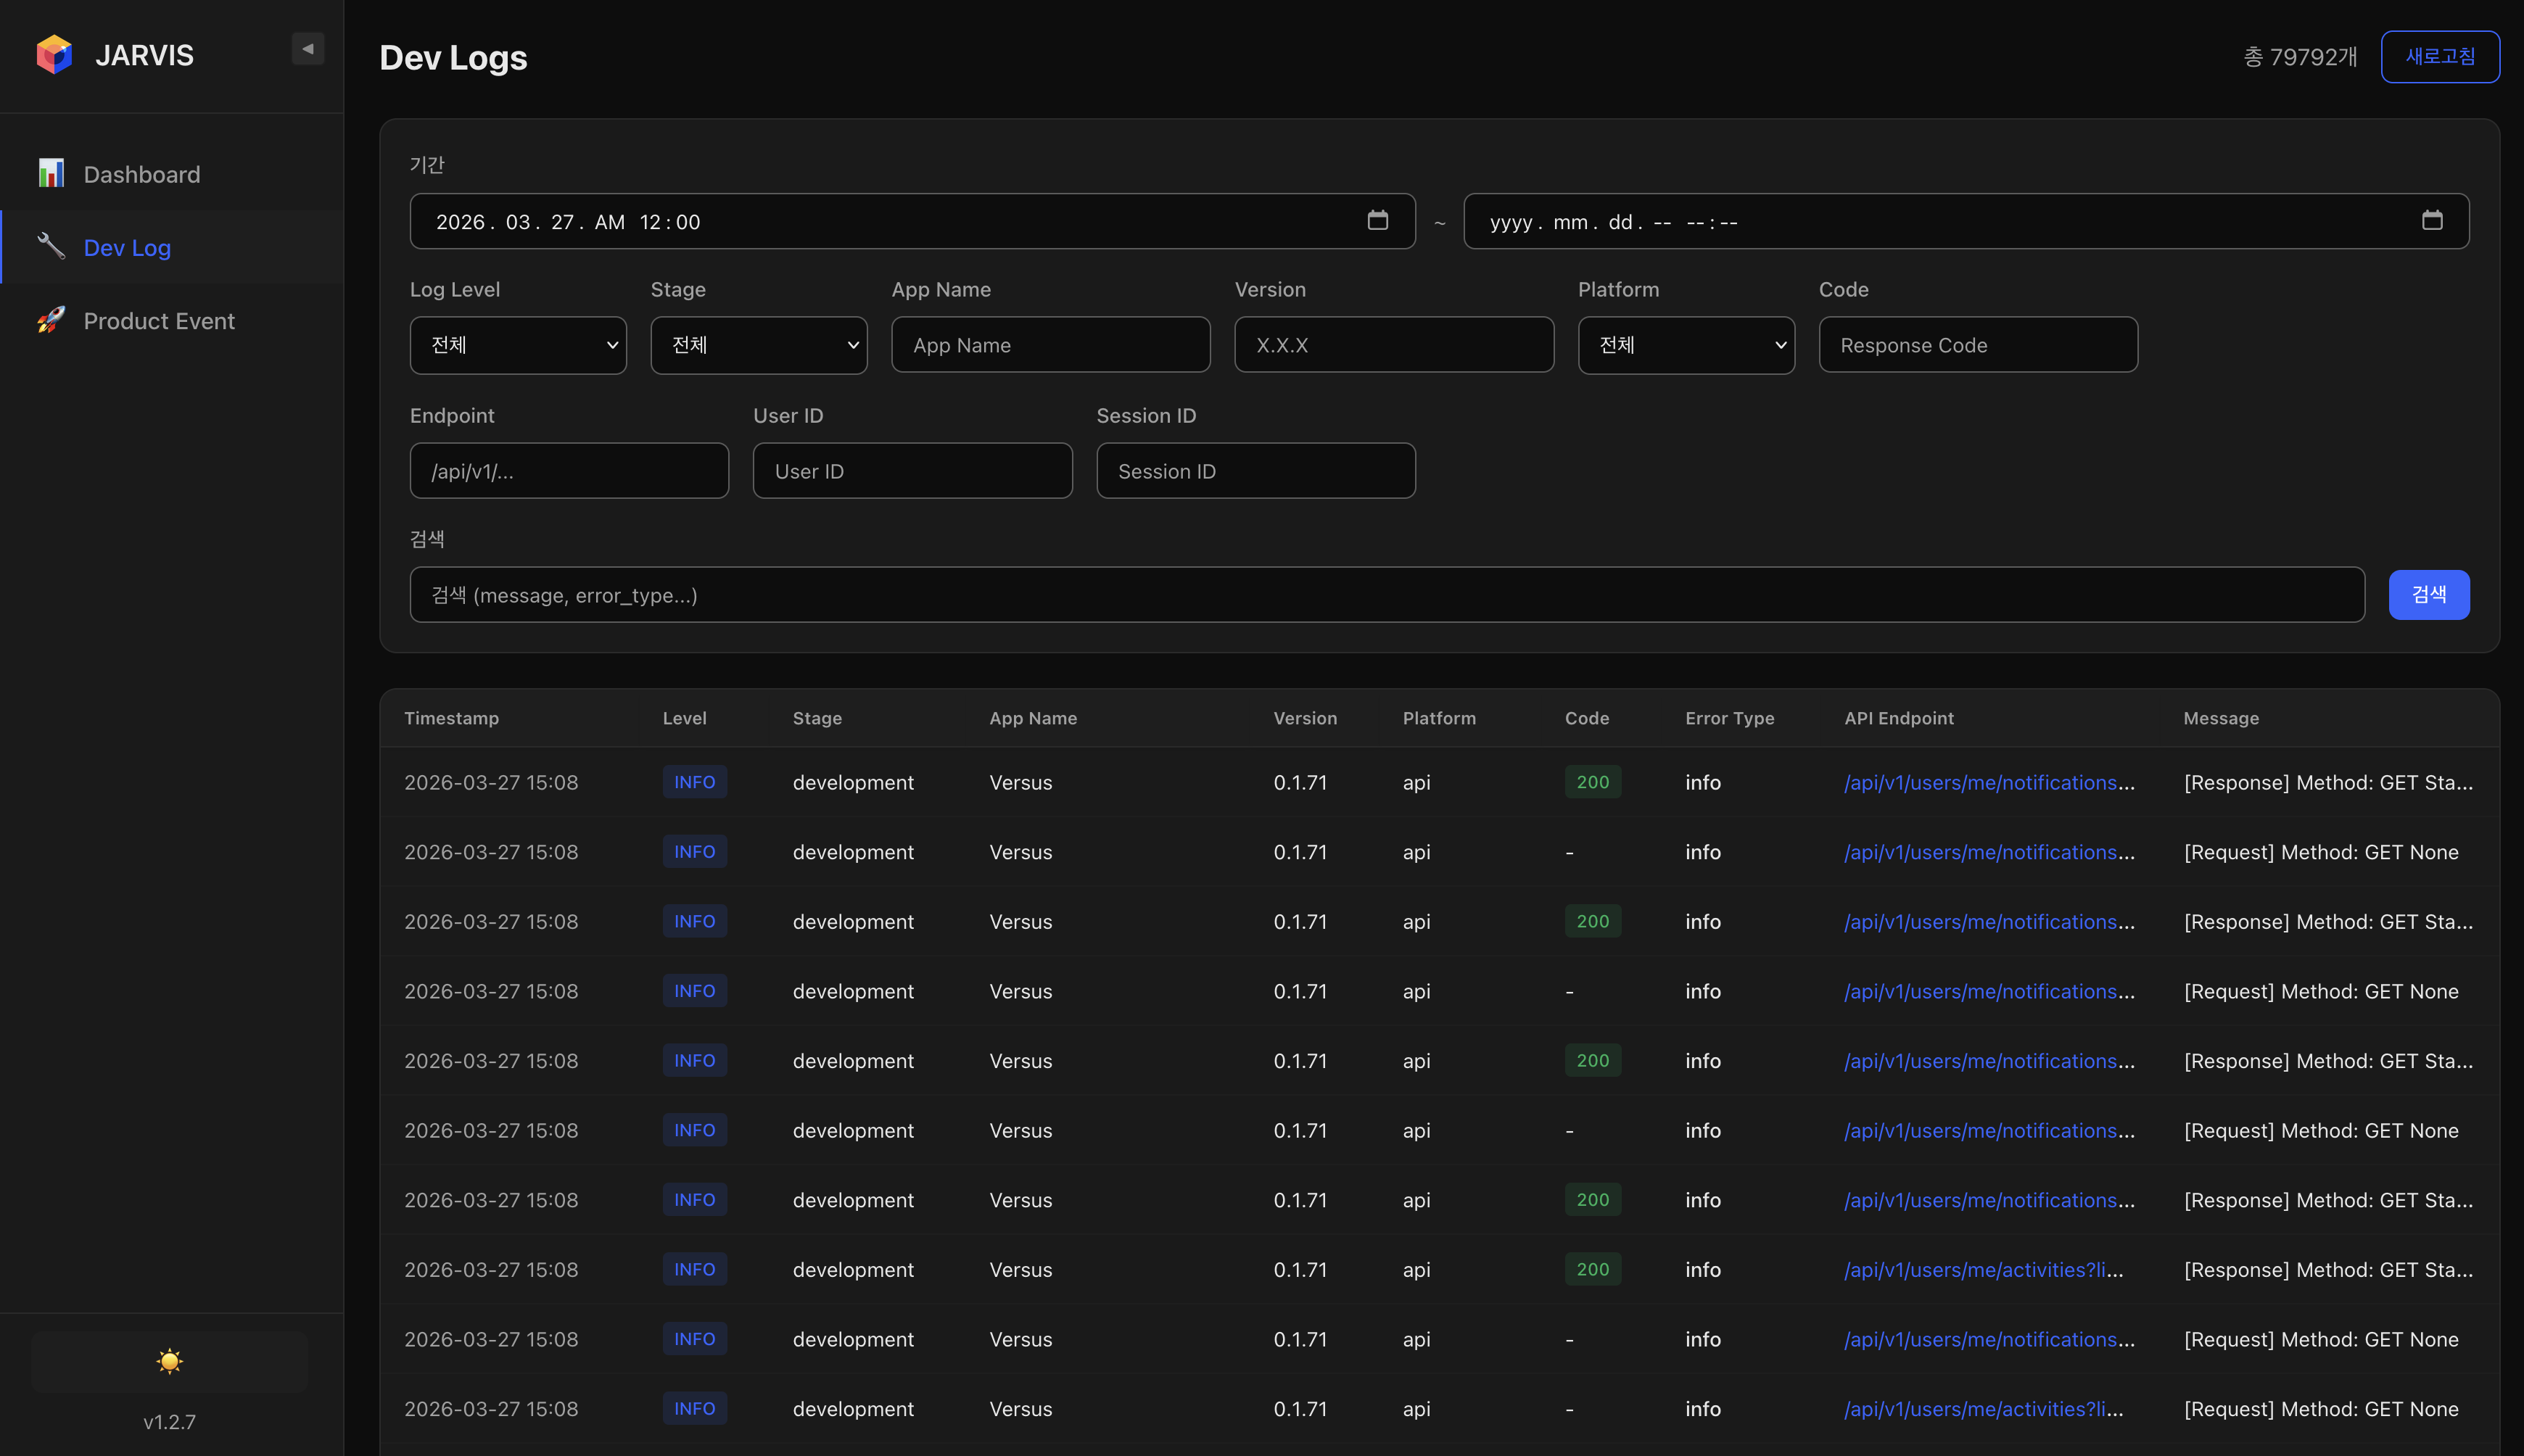
Log Level, Stage, App Name, Version, Platform, Code, Endpoint, User ID, Session ID 등 다양한 필터를 조합하여 원하는 로그를 빠르게 검색할 수 있다. Kibana 대비 직관적인 UI로 로그 탐색 속도를 높였다.Enables fast log search with various filter combinations including Log Level, Stage, App Name, Version, Platform, Code, Endpoint, User ID, and Session ID. Improved log exploration speed with a more intuitive UI compared to Kibana.
AI Query — 자연어 기반 로그 분석 (핵심 기능)AI Query — Natural Language Log Analysis (Core Feature)
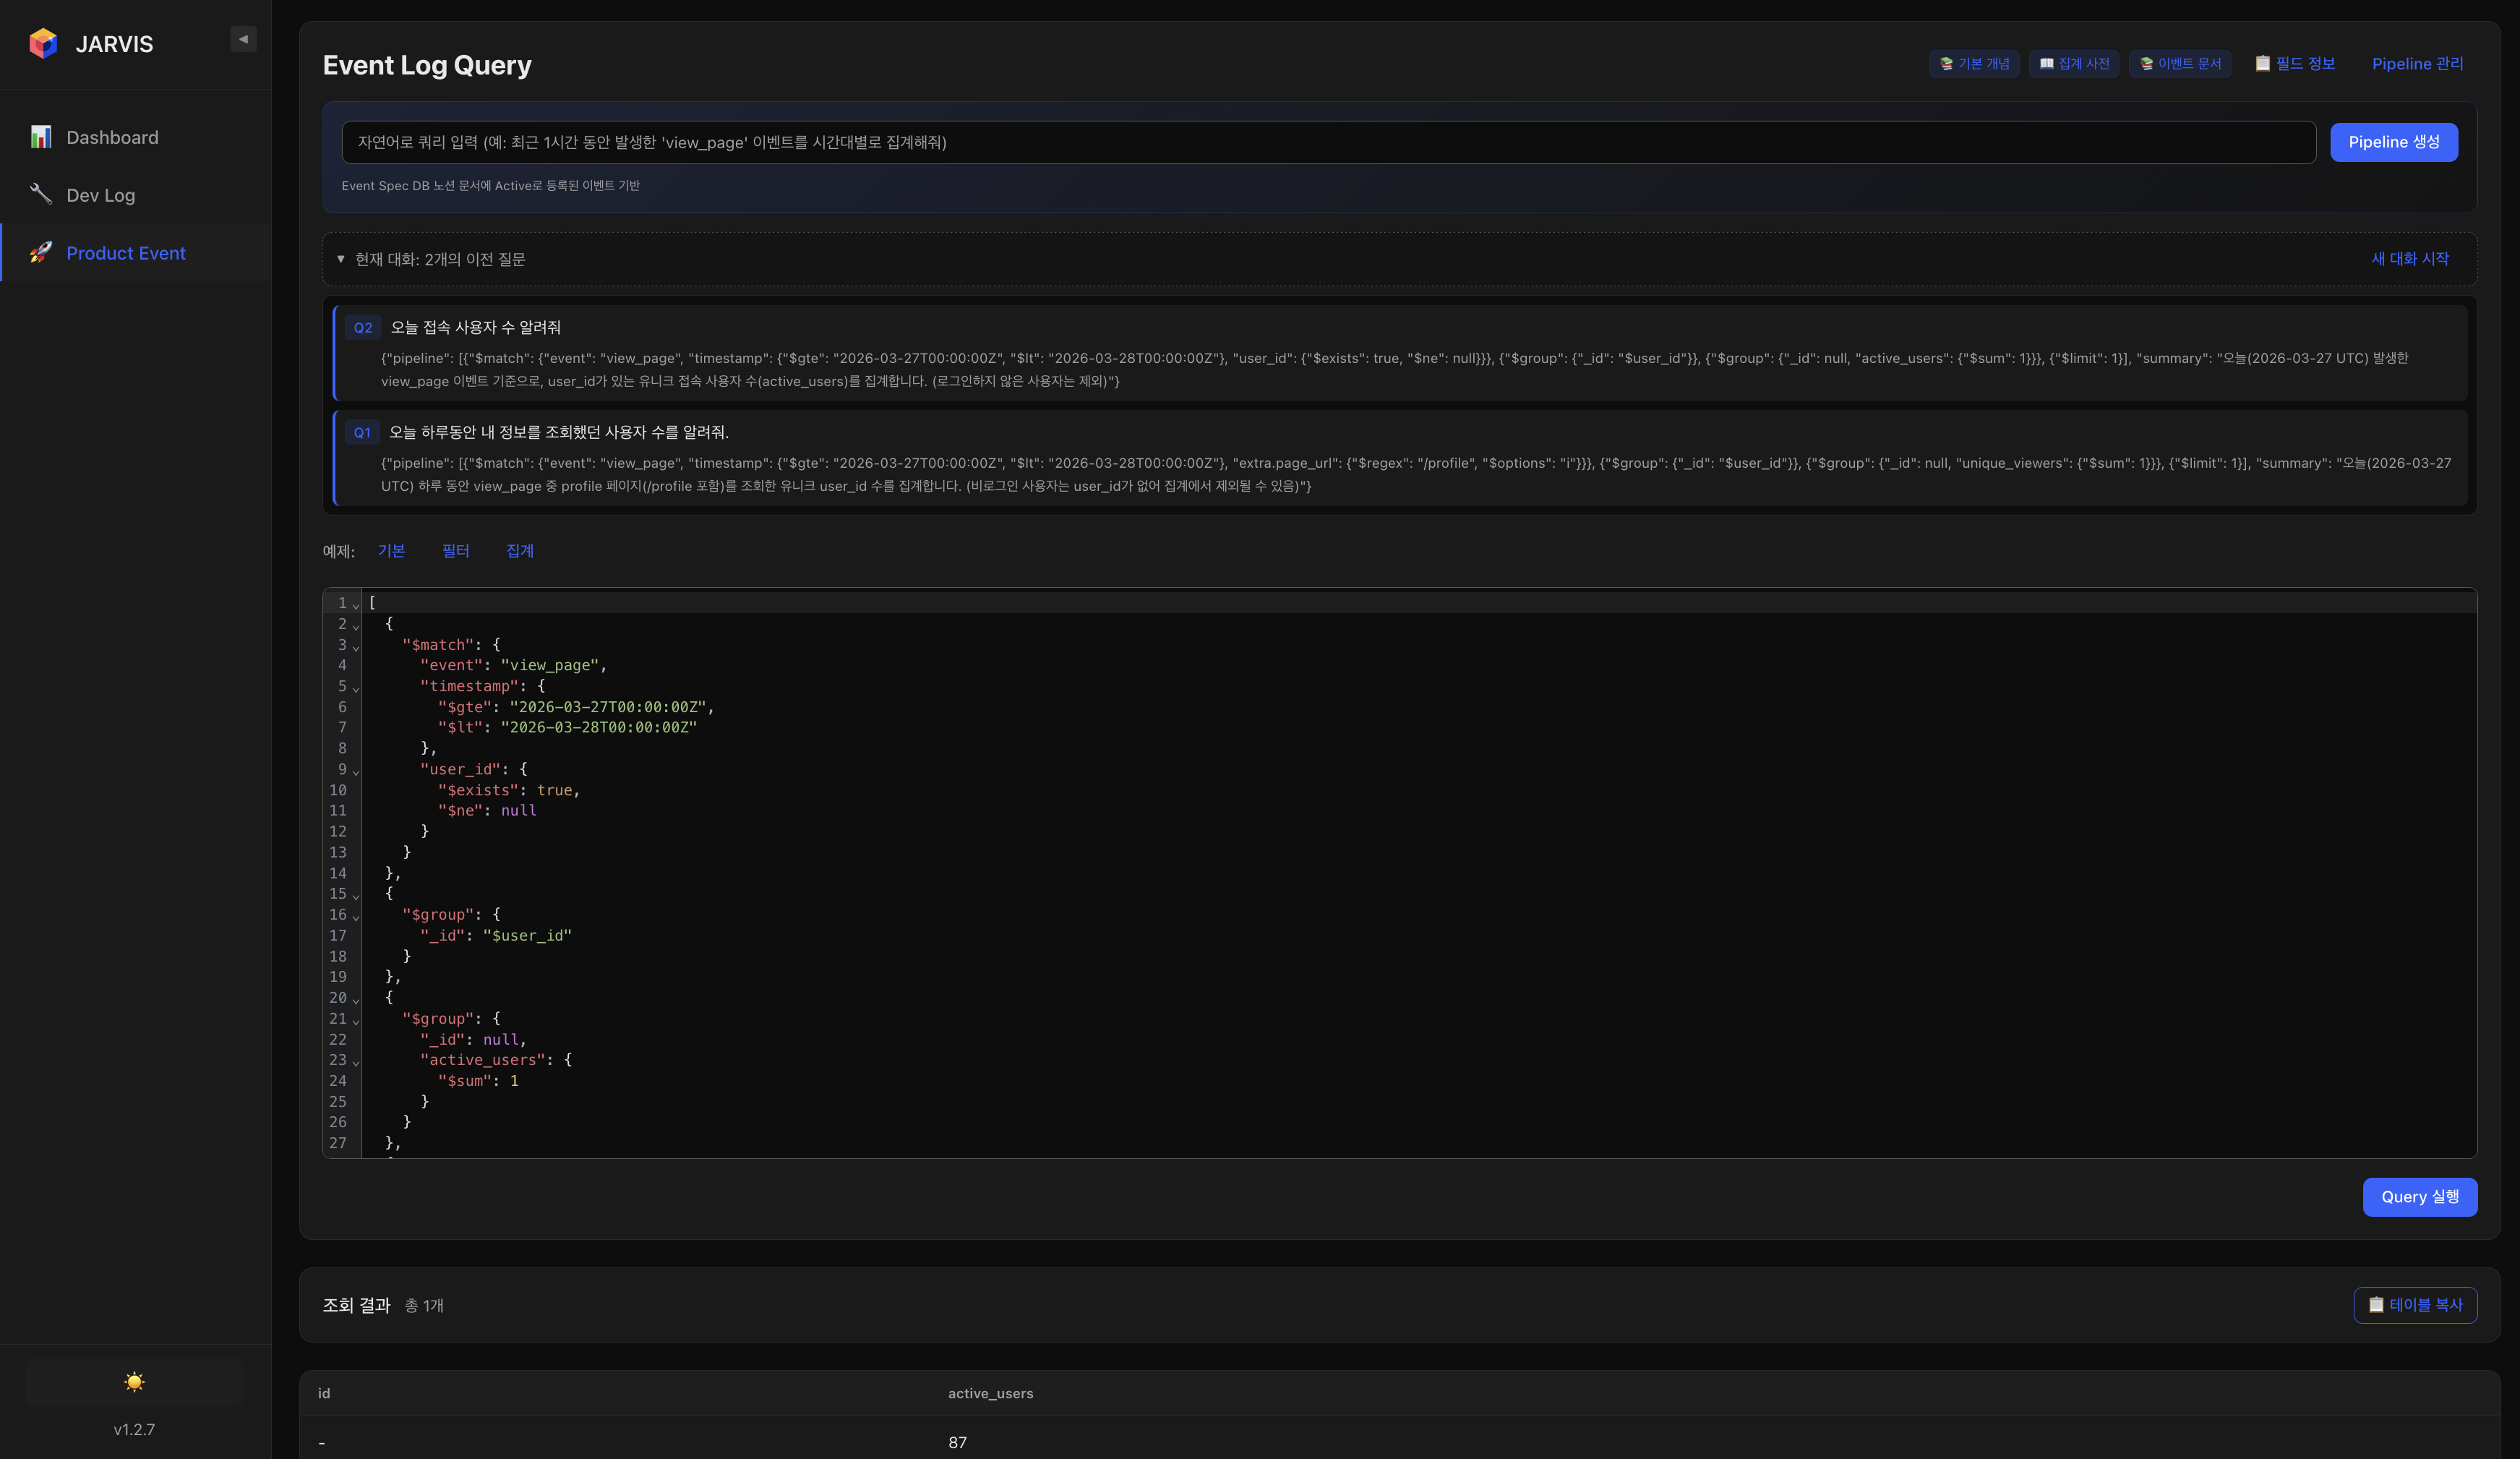
자연어로 로그 분석을 요청하면, LLM이 OpenSearch DSL 쿼리를 자동 생성하고 실행하여 결과를 반환한다. 프롬프트에 수집 중인 로그의 종류, 필드 구조, 데이터 포맷 등을 사전 정의하여 정확한 쿼리 생성을 유도했다.When users request log analysis in natural language, the LLM automatically generates and executes OpenSearch DSL queries, returning the results. The prompt is pre-configured with collected log types, field structures, and data formats to ensure accurate query generation.
활용 예시:Example Queries:
- "오늘 접속한 사용자 수 몇 명이야?""How many users logged in today?"
- "오늘 본인의 프로필을 조회한 사용자는 몇 명이야?""How many users viewed their own profile today?"
- "최근 view_page 이벤트를 가장 많이 발생시킨 유저는 누구야?""Which user triggered the most view_page events recently?"
이를 통해 PM, 마케터 등 비개발 직군도 OpenSearch 쿼리 지식 없이 로그 데이터를 직접 분석할 수 있게 되어, 로그 분석의 접근성을 크게 높였다.This enabled non-engineers such as PMs and marketers to directly analyze log data without OpenSearch query knowledge, significantly improving log analysis accessibility.
4. 성과 요약4. Results Summary
| 영역Area | 성과Achievement |
|---|---|
| Metrics | Prometheus + Grafana로 클러스터 / Namespace / 컨테이너 3계층 리소스 메트릭 실시간 수집 및 시각화Real-time 3-tier resource metric (Cluster / Namespace / Container) collection and visualization via Prometheus + Grafana |
| Logs | Fluent Bit DaemonSet으로 마이크로서비스 로그 중앙 집중화, OpenSearch & Kibana 기반 검색 / 분석 환경 구축Centralized microservice logs via Fluent Bit DaemonSet, with OpenSearch & Kibana-based search / analysis environment |
| Alerting | FastAPI Middleware 기반 5xx 에러 자동 감지 → Slack 실시간 알림 (서비스별 채널 분리, Stack Trace 포함)Automatic 5xx error detection via FastAPI Middleware → Real-time Slack alerts (per-service channels, Stack Trace included) |
| Log Analytics | OpenSearch 로그 기반 자체 메트릭 대시보드 구축 및 자연어 AI 쿼리로 PM/마케터 등 비개발 직군의 로그 분석 접근성 확보Built custom metric dashboard on OpenSearch logs and natural language AI query enabling log analysis accessibility for non-engineers (PMs/marketers) |
| 운영 효율Ops Efficiency | 장애 인지 시간을 수 분 ~ 수 시간에서 수 초로 단축, MSA 전체 환경에 대한 통합 운영 가시성 확보Reduced incident awareness time from minutes~hours to seconds, achieving unified operational visibility across the entire MSA environment |